Key Takeaways
- Supply chain KPIs in 2026 must move beyond reporting and become decision infrastructure for service, cost, resilience, and working capital.
- The strongest KPI frameworks are built around clear operational ownership across delivery, inventory, suppliers, financial efficiency, and risk.
- Metrics such as OTIF, inventory accuracy, supplier OTD, freight cost per unit, and forecast accuracy are most valuable when read together, not in isolation.
- Lagging indicators show where performance failed; leading indicators such as supplier lead time variability, days of supply, and forecast accuracy show where risk is forming.
- Future-ready supply chains will rely on tighter KPI systems, real-time visibility, and predictive signals to act before disruption reaches the customer.
Supply chain disruptions cost companies an estimated average of 8% of annual revenues in 2024, while only 6% of businesses reported full supply chain visibility, according to Procurement Tactics’ 2026 supply chain statistics roundup. That gap between exposure and awareness is no longer only a technology problem. It is a measurement problem.
The organisations absorbing the heaviest losses are not necessarily those with the most complex networks. They are often the ones managing through intuition, fragmented dashboards, lagging reports, and KPIs treated as compliance exercises rather than decision-making infrastructure.
In 2026, with geopolitical volatility, tariff shifts, labour disruption, climate events, and demand uncertainty reshaping trade flows, the margin for operating without structured measurement has narrowed. Operations leaders need a tighter set of metrics aligned to service, cost, cash, and resilience, reviewed frequently enough to influence action.
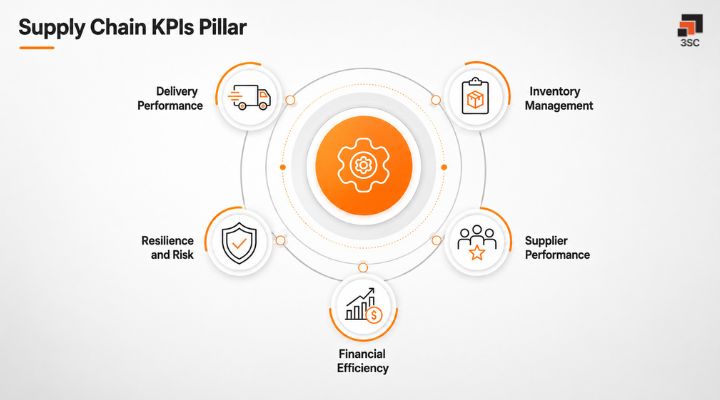
This guide covers the 20-supply chain KPIs that matter most, organised by the five functional pillars every operations leader is accountable for: delivery performance, inventory management, supplier performance, financial efficiency, and resilience.
What CSCOs Should Measure Differently in 2026
For CSCOs, tracking familiar KPIs is no longer enough. OTIF, inventory, supplier reliability, logistics cost, and forecast accuracy need to work together to show where performance is improving, where pressure is building, and where one decision may affect service, margin, cash, or customer trust. A strong KPI framework should help leaders see whether the supply chain is serving customers well, managing cost, freeing up working capital, and becoming more prepared for disruption.
The Framework: Five Pillars, Twenty Metrics
Rather than presenting an undifferentiated list, these 20 KPIs are grouped by operational domain. This structure reflects how high-performing supply chain organisations build dashboards: with clear ownership, visible interdependencies, and alignment to board-level outcomes.
A decline in OTIF may originate in demand planning, supplier performance, warehouse execution, production adherence, or transportation reliability. A rise in inventory cost may reflect weak forecast accuracy, lead time variability, poor SKU segmentation, or service-level buffers. The value of a KPI framework lies in making these connections visible before they become financial or customer-facing failures.
What are the Top Critical Supply Chain KPIs and Metrics To Track?
Pillar 1: Delivery Performance
Delivery metrics are the customer-facing edge of supply chain performance. They translate upstream decisions across procurement, production, inventory, and logistics into the outcome the market sees.
1. On-Time In-Full
OTIF expectations vary by sector and operating model. Consumer goods and retail-led supply chains usually work with tighter delivery expectations, while industrial supply chains may have more flexibility because of order complexity, longer lead times, and customer-specific agreements. But across sectors, the real value of OTIF is not just in the final percentage. It is in understanding why an order failed.
A missed OTIF target is rarely just a delivery issue. It often points to problems earlier in the chain, such as inaccurate demand planning, supplier delays, inventory gaps, production changes, or order errors that only become visible at the delivery stage.
2. On-Time Delivery Rate
OTD (On-Time Delivery) tracks the percentage of shipments delivered within the agreed timeframe, without the in-full requirement. It isolates transportation and carrier reliability as a standalone variable.
This distinction matters because a company may have strong OTD but weak OTIF. In that case, shipments are arriving on time, but not necessarily complete. The issue is likely linked to inventory availability, fulfilment execution, or order allocation rather than transport performance.
3. Perfect Order Rate
Perfect order rate captures the percentage of orders delivered on time, in full, undamaged, and with accurate documentation.
It is one of the most complete measures of supply chain execution quality because it combines fulfilment accuracy, delivery performance, product condition, and administrative accuracy into a single metric. A single failure on any dimension, whether a documentation error, damaged shipment, incorrect quantity, or delayed delivery, breaks the perfect order.
This strictness helps organisations identify which failure mode is pulling down the overall customer experience.
4. Order Cycle Time
Order cycle time measures the elapsed time from customer order placement to delivery.
Shorter cycle times indicate stronger coordination across order processing, inventory availability, production scheduling, warehouse execution, and transportation. In a 2026 environment where customer expectations for speed and reliability continue to rise across both B2B and B2C channels, cycle time is becoming a stronger competitive differentiator.
The more important signal is not only average cycle time, but cycle time consistency. A predictable fulfilment cycle gives customers confidence and gives internal teams a more stable operating rhythm.
5. Order Fill Rate
Order fill rate tracks the percentage of customer orders fulfilled completely from available stock at the time of order.
Where OTIF measures whether the final delivery promise was met, fill rate measures inventory readiness at the moment of demand. A low fill rate typically points to forecasting gaps, replenishment delays, supplier lead time variability, or inventory mispositioning across distribution nodes.
Pillar 2: Inventory Management
Inventory is simultaneously a cost lever and a risk buffer. The KPIs in this pillar show how well an organisation balances working capital efficiency with service-level protection.
6. Inventory Turnover
Inventory turnover measures how efficiently inventory is converted into sales or consumption over a defined period.
Higher turnover generally signals better demand alignment and tighter working capital management, while declining turnover can indicate slow-moving stock, forecast drift, overproduction, or excess buffer inventory. However, turnover must be interpreted by product category, lifecycle stage, margin profile, and service criticality.
A high-turnover spare part and a low-turnover critical component cannot be judged by the same inventory logic.
7. Days of Supply
Days of Supply measures how many days current inventory can satisfy expected demand at the current consumption rate.
It provides a forward-looking view of inventory coverage and helps planners identify both overstock and stockout risk before either materialises. In volatile supply environments, DOS becomes especially useful when paired with supplier lead time, demand variability, and service-level targets.
8. Inventory Accuracy
Inventory accuracy measures the alignment between recorded inventory in ERP or WMS systems and actual physical inventory.
Poor inventory accuracy directly weakens planning, fulfilment, and customer commitments. Teams may promise stock that does not exist, replenish locations that are already covered, or delay orders because the system does not reflect physical availability.
As companies increase automation, real-time planning, and omnichannel fulfilment, inventory accuracy becomes a prerequisite for every downstream KPI.
9. Stockout Rate
Stockout rate tracks the frequency with which demand cannot be met due to inventory unavailability.
Beyond immediate lost sales, stockouts damage service reliability and customer trust. In categories where customers can easily switch suppliers or brands, the longer-term cost can be greater than the value of the missed order.
Stockout rate should be analysed by SKU, node, channel, customer segment, and root cause to distinguish planning gaps from supplier delays, allocation issues, or warehouse replenishment failures.
10. Carrying Cost of Inventory
Carrying cost measures the total cost of holding inventory, including warehousing, insurance, shrinkage, obsolescence, handling, and the opportunity cost of capital.
Industry estimates often place inventory carrying costs in the range of 20–30% of inventory value annually, although the figure varies significantly by sector, product type, interest rates, and storage requirements.
The objective is not to reduce carrying cost blindly. It is to release trapped capital without increasing stockouts, service failures, or production risk.
Pillar 3: Supplier Performance
Supplier KPIs sit at the upstream boundary of supply chain control. They measure the reliability of inputs before disruptions cascade into production delays, inventory shortages, premium freight, and missed customer commitments.
McKinsey’s supply chain risk research shows that companies have been increasing visibility beyond tier-one suppliers, particularly as tariff pressure and geopolitical uncertainty expose deeper network dependencies.
11. Supplier On-Time Delivery
Supplier OTD measures the percentage of purchase orders delivered by suppliers within the agreed delivery window.
It is the inbound counterpart to outbound delivery performance and one of the earliest indicators of downstream OTIF risk. Late supplier deliveries can force production rescheduling, increase safety stock, trigger expediting, or delay customer fulfilment.
The metric should be segmented by supplier, material criticality, geography, plant, and sourcing model. A delay from a single-source supplier for a critical component carries a very different risk profile from a delay on a non-critical item.
12. Supplier Quality Rate / Defect Rate
Supplier quality rate tracks the percentage of incoming materials or components that meet required specifications without rejection, rework, or quality hold.
Defective inputs create compounding costs across inspection, rework, replacement sourcing, production downtime, warranty exposure, and customer complaints. A supplier that delivers on time but fails quality standards still creates supply chain instability.
Supplier quality and supplier OTD should therefore be read together rather than managed as separate scorecard items.
13. Purchase Order Accuracy Rate
Purchase order accuracy measures how frequently purchase orders are processed without errors in quantity, pricing, specifications, supplier details, delivery date, or payment terms.
Low PO accuracy is often a symptom of manual processes, poor master data, weak ERP discipline, unclear contracts, or limited integration between procurement and finance. These errors may appear administrative, but they often create delivery disputes, invoice delays, excess inventory, or supplier friction.
14. Supplier Lead Time Variability
Supplier lead time variability measures how much actual supplier delivery times fluctuate around the expected lead time.
This metric is often more revealing than average lead time. A supplier with a slightly longer but stable lead time can be easier to plan around than a supplier with a shorter average lead time and frequent variation.
High variability increases buffer stock, complicates production planning, and raises the likelihood of expediting. Reducing variation often creates more value than reducing average lead time alone.
Pillar 4: Financial Efficiency
Financial KPIs connect supply chain operations to P&L, working capital, and enterprise value. These are the metrics that help operations leaders translate execution performance into business impact.
15. Total Supply Chain Cost as a Percentage of Revenue
This metric captures total supply chain operating cost as a percentage of net revenue. It may include procurement operations, production, warehousing, transportation, inventory carrying cost, returns, and related overhead.
It is useful for understanding whether supply chain cost is scaling efficiently with business growth. Rising revenue can hide cost leakage, but this KPI shows whether the network is becoming more or less efficient.
For meaningful analysis, it should be segmented by business unit, region, product category, customer segment, and channel.
16. Cash-to-Cash Cycle Time
Cash-to-cash cycle time measures the number of days between paying suppliers and receiving payment from customers.
The standard formula is:
Days Inventory Outstanding + Days Sales Outstanding − Days Payable Outstanding
This metric connects supply chain performance directly to liquidity. Excess inventory, long production cycles, slow fulfilment, delayed invoicing, or weak receivables discipline can all increase the cash-to-cash cycle.
For operations leaders, it is one of the most useful metrics for linking supply chain decisions to working capital performance.
17. Freight Cost per Unit
Freight cost per unit measures total transportation expenditure divided by the number of units shipped, orders fulfilled, weight moved, or revenue delivered.
It is more useful than total freight spend because it adjusts for business volume. A rise in freight cost per unit may indicate inefficient routing, poor load consolidation, excessive spot buying, carrier mix issues, low truck utilisation, or increased expedite dependency.
18. COGS Variance
COGS variance measures the difference between planned and actual cost of goods sold.
Persistent unfavourable variance may reflect supplier price escalation, material substitution, production yield loss, quality rework, premium freight, or planning instability. The value of this metric increases when it is reviewed alongside supplier quality, forecast accuracy, production adherence, and freight cost.
Pillar 5: Resilience and Risk
Resilience KPIs are becoming more strategically important as disruption becomes a constant feature of supply chain management. Traditional metrics show current performance; resilience metrics show how prepared the network is to absorb shocks and recover.
The Business Continuity Institute’s 2024 Supply Chain Resilience Report found that almost 80% of organisations experienced supply chain disruption over the previous twelve months, reinforcing why resilience can no longer be managed informally.
19. Supply Chain Resilience Index
A Supply Chain Resilience Index is a composite score that combines multiple risk indicators into one executive-level view.
It may include supplier redundancy, geographic concentration, tier visibility, recovery time, alternate sourcing coverage, logistics route risk, inventory buffer adequacy, and critical material exposure.
Unlike OTIF or inventory turnover, this is not a single process metric. It is an aggregated signal of how prepared the network is to absorb disruption, maintain service, and recover within acceptable timeframes.
20. Forecast Accuracy
Forecast accuracy measures how closely demand forecasts align with actual demand.
Although it is often treated as a planning KPI, forecast accuracy has direct implications for resilience. Poor forecasts inflate safety stock, increase carrying cost, disrupt supplier schedules, weaken production planning, and reduce customer service reliability.
Leading organisations are now supplementing traditional statistical forecasting with AI-driven demand sensing, using external signals such as point-of-sale data, market indicators, weather patterns, macroeconomic data, and customer behaviour to improve short-term responsiveness.
KPI Trade-offs Supply Chain Leaders Cannot Miss
After looking at the core KPIs across delivery, inventory, suppliers, cost, and resilience, the next step is to understand how these metrics interact. No KPI improves in isolation, and every improvement can create pressure somewhere else in the supply chain.
OTIF vs Inventory Cost
Improving OTIF often requires better stock availability, but this can increase inventory buffers and carrying cost. Leaders need to check whether higher service levels are being achieved through better planning or simply by holding more stock.
Inventory Turnover vs Stockout Risk
Higher inventory turnover can improve working capital because stock moves faster through the business. But if inventory is reduced too aggressively, the supply chain may become more exposed to demand changes, supplier delays, and stockouts.
Freight Cost vs Delivery Reliability
Reducing freight cost can support margin, but it should not come at the expense of delivery performance. If cheaper lanes, slower modes, or lower-cost carriers lead to missed delivery windows, the saving may create a bigger service problem.
Supplier Cost vs Quality
Lower sourcing cost can look attractive, but it may increase defects, rework, inspection effort, or disruption if supplier quality is weak. Supplier cost should always be reviewed alongside quality rate, defect rate, and delivery reliability.
Cash-to-Cash vs Supplier Stability
Longer payment terms may improve the company’s cash position, but they can also put pressure on suppliers, especially smaller or critical partners. CSCOs need to balance working capital goals with supplier reliability and long-term supply continuity.
These trade-offs are the reason KPI frameworks need to support decisions, not just reporting. The strongest supply chain teams use metrics to see where performance is improving, where risk is building, and where action is needed before the impact reaches the customer or the P&L.
Conclusion
Supply chain KPIs are no longer passive reporting tools. In 2026, they form the measurement infrastructure operations leaders need to manage service, cost, cash, and resilience in a more volatile environment.
The strongest KPI frameworks are focused, connected, and actionable. They do not treat OTIF, inventory, supplier reliability, logistics cost, and forecast accuracy as separate dashboard items. They connect them into one operating view that shows where performance is drifting and where action is required.
The organisations that perform best will not be the ones tracking the most metrics. They will be the ones measuring the right signals, reviewing them at the right cadence, and using them to make faster, better supply chain decisions.
This is where 3SC’s AI-powered supply chain planning, execution, and control tower solutions can help organisations turn KPIs into action. By connecting data across demand, inventory, suppliers, logistics, and risk, 3SC enables leaders to track the right metrics, identify early warning signals, and make faster decisions.
Related Read & Guides
- Supply Chain Trends
- Supply Chain Analytics
- Supply Chain Planning
- Supply Chain Control Tower
- Supply Chain Intelligence