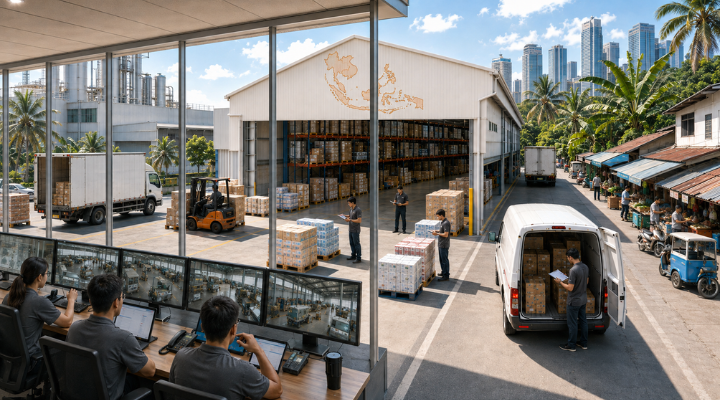
A stronger distributor visibility model connects downstream sales, inventory movement, and route-to-market performance into one decision layer. This enables FMCG teams to detect demand shifts earlier, identify inventory imbalances across territories, and trigger the right replenishment, allocation, or distribution action before service levels are affected.
Key Takeaways
- Distributor inventory provides an important supply signal, but it does not show actual downstream demand.
- Secondary sales visibility helps companies understand how products are moving beyond the distributor.
- Route-to-market analytics connects downstream sales with coverage, service, inventory, and distribution cost.
- Better distributor visibility supports more accurate replenishment, allocation, and inventory decisions.
- From 2026 onward, downstream visibility will become increasingly important to supply chain planning and execution governance.
A distributor in Indonesia receives a large shipment ahead of a seasonal promotion. Over the next few weeks, some retailers sell through the stock quickly, while others continue to hold the same products. A smaller pack starts moving faster in one city, but the manufacturer does not see the change until the next distributor order arrives.
The company knows how much it shipped and how much inventory the distributor is holding. What it cannot see clearly is how products are moving across retailers and territories. This creates a practical supply chain problem: distributor inventory can be visible while actual market movement remains unclear.
The issue is more significant across Southeast Asia, where FMCG companies serve traditional trade, modern retail, e-commerce, marketplaces, and geographically dispersed markets. As these channels continue to develop in 2026, supply chain teams need clearer visibility into what is selling, where it is selling, and how quickly inventory is moving through the network.
Why the Distributor Handoff Creates a Planning Gap
Southeast Asia does not operate as one uniform retail market. Traditional trade remains significant alongside modern retail and rapidly growing digital channels. Indonesia, Singapore, Thailand, the Philippines, and other Asian markets also shows how differently consumers are using retail channels, with traditional stores remaining important while e-commerce and social commerce continue to develop.
The result is that a distributor's order can become an imperfect proxy for demand.
Rising orders might mean consumption is picking up, or they might simply reflect a promotion, a distributor building stock, a change in ordering frequency, or preparation for a seasonal period. Falling orders raise the opposite risk: the distributor may already hold sufficient stock even as retailer-level demand stays healthy.
The supply chain therefore needs to look beyond the transaction between manufacturer and distributor.
Secondary Sales Show What Happens After the Shipment
Primary sales tell the manufacturer how much product has moved into the distribution network. Secondary sales provide a closer view of how that product moves from distributors to retailers and other downstream channels.
The difference becomes important when inventory and demand do not move together.
Suppose a distributor's primary orders increase by 15% before a promotion. If secondary sales rise at a similar rate, the increase is more likely to reflect genuine market movement. If secondary sales remain flat while distributor inventory rises, the additional stock may simply be sitting in the channel.
The same comparison can reveal emerging shortages.
If secondary sales accelerate while distributor inventory falls faster than expected, replenishment may need to be brought forward. Waiting for the next distributor order could mean responding after retailers have already experienced availability problems.
Secondary sales can therefore support several decisions:
- Demand planning: Actual downstream movement provides another signal alongside distributor orders and historical sales.
- Replenishment: Faster-moving products and territories can be prioritised before inventory reaches critical levels.
- Allocation: Stock can be directed toward markets where demand is stronger instead of being distributed according to historical patterns alone.
- Promotion evaluation: Sales movement can help determine whether a promotion is generating sustained demand or simply increasing inventory within the channel.
The objective is not to replace primary sales. It is to understand what primary sales mean.
See Demand at the Level Where It Is Happening
A country-level sales number can hide significant differences between territories.
A beverage may be selling strongly in Jakarta but slowing in another Indonesian market. A personal care SKU may be growing through modern trade while traditional retail remains flat. A smaller pack may be gaining traction through digital channels while larger packs continue to dominate neighbourhood stores.
When these movements are combined into one regional or national number, planners can miss the changes that matter operationally.
Distributor visibility should therefore extend across four levels.
- Product: Different SKUs, pack sizes, and variants can follow very different demand patterns. Inventory and replenishment should reflect those differences.
- Location: City, territory, and distributor-level information can show where demand is increasing, declining, or becoming unpredictable.
- Channel: General trade, modern trade, e-commerce, and other channels have different order frequencies, assortment requirements, and service expectations.
- Distributor: Comparing distributors can reveal differences in sales movement, stock levels, coverage, and service performance.
This level of detail is becoming more important as digital channels grow. Research reported that Southeast Asia's digital economy was on track to exceed US$300 billion in GMV in 2025, with e-commerce GMV reaching US$185 billion by 2030.
For FMCG supply chains, the implication is not that physical distribution is becoming less relevant. It is that companies need to understand how demand is moving between different routes to market.
Getting this level of detail right matters only if the network delivering against it is actually working, which is where route-to-market analytics comes in.
Connect Distributor Visibility with Route-to-Market Decisions
Knowing where products are selling is only one part of the problem. Companies also need to know whether their distribution network is reaching those markets efficiently.
This is where route-to-market analytics becomes useful.
Instead of measuring distributors mainly through sales volume, companies can assess the relationship between market coverage, sales movement, inventory, service, and cost to serve.
- Market coverage shows whether distributors are reaching the intended outlet base. A distributor may generate strong sales while serving a relatively narrow group of high-volume outlets, leaving other parts of the territory under-served.
- Inventory movement shows whether stock is flowing at an expected rate. Persistent stock at one distributor alongside shortages elsewhere may indicate an allocation issue rather than a supply shortage.
- Service performance shows whether retailers are receiving products consistently. Repeated fulfilment problems can point to delivery frequency, transport capacity, or distributor operating issues.
- Cost to serve connects route decisions with logistics economics. Delivery frequency, distance, handling, warehousing, and local distribution structures all influence the cost of reaching different markets.
Together, these measures give supply chain teams a clearer understanding of whether the route-to-market model is working as intended.
The question is no longer simply whether a distributor is meeting its sales target. It is whether the network is getting the right products to the right markets at the required service level and at a reasonable cost.
Use Downstream Data to Position Inventory Better
Distributor visibility becomes more useful when it changes inventory decisions.
An FMCG company can have sufficient stock across a country and still experience stockouts because inventory is sitting in the wrong locations. One distributor may have several weeks of a slow-moving SKU while another is running short of the same product.
Without downstream sales information, the usual response may be to send more stock.
That can increase the imbalance.
Comparing secondary sales with distributor inventory provides a better basis for deciding where stock needs to be replenished, transferred, slowed down, or redirected.
This is especially relevant for products with limited shelf life. When demand slows in one territory, additional inventory can increase expiry or markdown risk. When demand accelerates elsewhere, insufficient stock can result in lost sales.
Inventory policies should therefore reflect actual market movement. Reorder levels, safety stock, replenishment frequency, and allocation rules may need to differ by product, location, channel, and distributor rather than following one broad policy.
The aim is simple: place inventory closer to where it is likely to be consumed, without building unnecessary stock elsewhere.
Turn Visibility into Coordinated Execution
Better distributor data does not automatically improve supply chain performance. The information needs to reach the teams making decisions about demand, inventory, production, logistics, and customer commitments.
Consider a territory where secondary sales suddenly increase while distributor inventory falls. The response may involve bringing forward replenishment, reallocating stock from another location, increasing production, or changing transport priorities.
Different functions may be involved in each decision.
Demand planners need to determine whether the increase is temporary or likely to continue. Inventory teams need to check available stock across the network. Production teams need to assess whether additional supply is possible. Logistics teams may need to adjust delivery plans.
If these teams work with different information, the response can take longer than the market allows.
A stronger process connects the downstream signal with the relevant supply chain decisions. Significant changes should have clear ownership, an agreed response, and a defined timeframe for action.
This also improves distributor discussions. Instead of reviewing only sales targets and inventory levels, manufacturers and distributors can jointly examine secondary sales, service performance, coverage, and stock movement to identify where corrective action is needed.
Make Distributor Governance More Data-Based
Distributor governance has traditionally focused on measures such as sales, inventory, payment, and service levels. These remain important, but they do not always explain why performance is changing.
Adding downstream measures creates a more complete picture.
For example, falling distributor sales could be caused by weaker consumer demand, poor outlet coverage, pricing changes, product availability, or excess inventory already sitting in the channel. Each requires a different response.
Similarly, high distributor inventory does not always mean poor performance. It may reflect a planned seasonal build, a major promotion, or an upcoming change in demand.
This is why distributor governance should focus on movement and causes, not just outcomes.
Regular reviews can bring together secondary sales, inventory ageing, service levels, outlet coverage, and cost-to-serve. The purpose is to identify exceptions early and agree on actions before they become larger supply or commercial problems.
What Changes From 2026 Toward 2030?
The downstream FMCG network in Southeast Asia is likely to become more varied, not less.
Traditional trade will remain important, while modern retail, e-commerce, marketplaces, social commerce, and other digital channels continue to develop. NIQ reported in 2025 that Southeast Asia's FMCG e-commerce market had doubled over the previous five years and was expected to double again over the next five. It also projects e-commerce to account for 30% of FMCG retail sales in Asia by 2030.
For supply chain teams, this makes downstream information increasingly important.
The future requirement is not necessarily to capture every transaction from every outlet. It is to connect the information that materially affects supply decisions: primary sales, secondary sales, distributor inventory, market coverage, service performance, and route-to-market cost.
By 2026 and toward 2030, this information will increasingly need to feed demand planning, inventory decisions, allocation, replenishment, and execution reviews.
The companies that build this connection will be better placed to recognise changes in market movement before those changes appear as stockouts, excess inventory, or missed sales.
Conclusion: Move Beyond Distributor Visibility
Distributors will remain central to FMCG distribution across Southeast Asia. The issue is not the distributor model. The issue is treating the distributor as the last point of supply chain visibility.
Had the manufacturer in our opening Indonesian example had that visibility, the shift toward the smaller pack in that city would have shown up within days of it happening, not at the next distributor order, by which point the excess stock or the shelf gap was already locked in.
A shipment shows that products have entered the network. Distributor inventory shows what is available. Secondary sales show what is moving. Route-to-market analytics shows how effectively that movement is being achieved.
Connecting these views gives supply chain teams a better basis for decisions about forecasting, replenishment, allocation, inventory, service, and distribution cost.
As Southeast Asian FMCG channels continue to develop through 2026 and beyond, the stronger supply chains will not simply know how much product is sitting with distributors.
They will know how that inventory is moving through the market, and act before the next shortage, excess, or missed sales opportunity appears.
Strengthen Distributor Visibility With 3SC
3SC helps FMCG companies close the distributor visibility gap end to end: integrating secondary sales data alongside primary orders and distributor inventory, building route-to-market cost-to-serve models that show where coverage and service are falling short, and running the governance reviews that turn these signals into replenishment, allocation, and production decisions before they show up as stockouts or excess stock.